E. Klimenkov, N. Mamuchashvili, Yu. Milichenko, V.Voevodin
Institute for High Energy physics, Protvino, 142284, Russia
The IHEP Accelerator Complex U-70 occupies a significant territory: the distance between its elements located in the tunnels and technological buildings makes hundreds of meters. The complex includes 30 MeV linac, 1.5 GeV booster and U-70 proton synchrotron that are managed by the system of control rooms: main control room and several local control rooms situated near the process equipment. At the time of the accelerator operation the personnel requires information on the current state of various systems of the complex as a whole. An opportunity to observe distant electrical signals aids to diagnose malfunctions, to reach coordinated decisions, to facilitate scientific researches. Distributed Analog Signal Observation System (ASOS) provides this opportunity for the Accelerator Complex U-70.
The following resources are used for the system:
- personal computers (PCs), equipped with GPIB cards (General Purpose Interface Bus);
- digital oscilloscopes TEKTRONIX and LECROY that are currently in operation ( GPIB interface is included into the base configuration of these oscilloscopes);
- U-70 Control System (CS) in operation [1,2].
By the time of ASOS creation we already had some experience in communication between oscilloscopes and PCs via GPIB under DOS and WINDOWS operating systems, but could not use it within the framework of the uniform Control System, based on DEC ALPHA stations and other computers with UNIX. Linux operating system on PCs and availability of the GPIB driver for Linux solved this contradiction and analog signal observation was included into the Control System as a new application task.
An application development for U-70 Control System should follow several base rules:
- The operator interface is separated from an application and is carried out by standard means of CS in the form of operations on database (DB) objects. A developer creates only a description of task menu and a control table structure supplied by necessary texts;
- Data storage and representation are separated from an application. The visualization of data is performed on CS high level computers only, in the strictly standard form. A developer creates full description of tables, necessary for a task, with their specific names and sizes;
- The application program performs a task algorithm according to the parameters stored in the DB-control table and puts results into the database, filling in the appropriate tables;
- The application program can also carry out some specific processing of the measured data and create a non-standard picture in a bitmap format. In our case the program builds three-dimensional images for the data of LeCroy oscilloscopes running in the "Sequence mode".
According to the stated principles this paper pays the main attention to the measuring part of the system and to parameters of its management. The various menus and measurement results are represented as illustrations.
1 MEASURING PART OF ASOS
1.1 Hardware Components
At the present moment the measuring part is based on four PCs situated in the main control room, in the booster control room, in the linear accelerator control room and in the ejection system control room (see Fig.1).
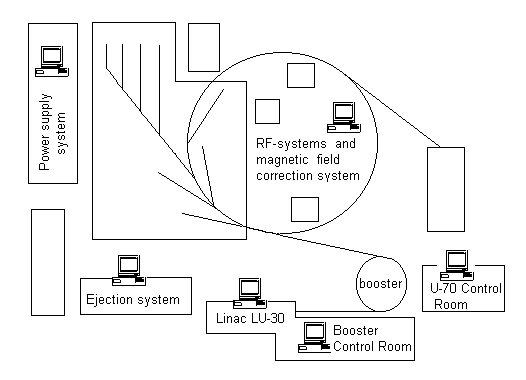
Figure 1: Layout of ASOS elements.
Two more computers for the power supply system, RF and magnetic field correction systems are planned to be installed. Applied technical solution and time characteristics of the accelerator U-70 (supercycle duration is about 10 seconds) have stipulated the requirements for the minimal PC configuration: this is Intel 386 with 120 Mbytes hard disk and 8 Mbytes RAM. Every computer has one ISA GPIB PCIIA card and is connected to the 10Mbps Ethernet network. Currently each computer serves 6 oscilloscopes. The system allows easily to increase this number up to 14 - the maximum number of devices served by GPIB card.
1.2 Software Components
Each computer contains:
- the operating system Red Hat Linux 4.1(kernel 2.0.27);
- the GPIB driver from Linux Lab Project [3];
- the part of distributed accelerator database[1], related with the accelerator subsystem, which analog signals are supervised by the computer. There is no difference for software between elements of the database physically located in machines of a different type, in PC or in DEC Station.
- the resident database server;
- the resident remote application loader;
- the loaded application which carries out the interaction between oscilloscopes and the database, and builds specific BMP pictures.
The system provides three oscilloscope measurement modes:
-
Single Acquisitions - single "time--voltage" curves for Tektronix and LeCroy;
-
Sequence Acquisitions - sequence of "time-voltage" curves for LeCroy;
-
Screen Hardcopy - graphical screen copies - for Tektronix and LeCroy.
The program works according to the parameters, which are read from the control table at the beginning of the operation cycle. Dialogue with oscilloscopes is carried out in the internal language of each of them [4,5] .
Measurements synchronization uses the trigger process and its software that are inherent in the oscilloscopes. The screen hardcopies are read just after reception of the digital data and thus they are adhered to the same trigger. At the present moment the oscilloscopes are served consistently. All programs are written in C language.
2 INTERFACE WITH OPERATORS
A dialogue with operators is made via a network of X-terminals. Two examples of user interface are presented below.
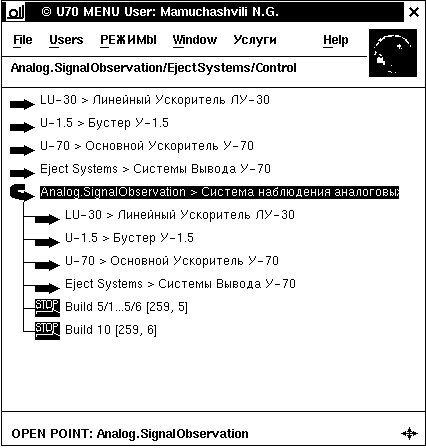
Figure 2: Control System menu.
General menu of the Control System is shown in Fig. 2. The ASOS part is presented here in the open form with its subitems corresponding to the job of one of the ASOS PCs.
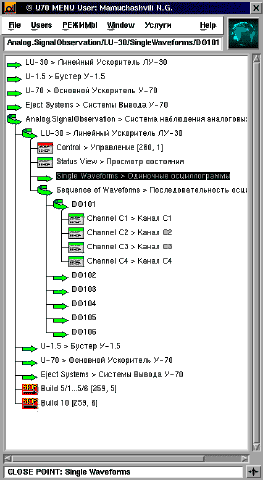
Figure 3: ASOS menu for the Linear Accelerator.
The LU-30 subitem is presented in Fig. 3 in the open form. An operator can choose here SINGLE or SEQUENCE data for the Linear Accelerator.
All oscilloscopes have symbolic names for their identification. They are symbols "DO"(Digital Oscilloscope) and numbers meaning technological installation and a floor, where this device is located. The last figure of any symbolical name coincides with the physical address on GPIB bus.
A set of tables with unique names is created in the database for each oscilloscope. The table name includes the oscilloscope symbolic name, the type of measurements, the input channel number. According to the standards of the Control System there are tables of statistics, where the data for 30 consecutive accelerator cycles are saved.
Hardcopy files are stored in a special working directory. Statistics for Hardcopy files is not stipulated. The measurement results are available in the form of "time--voltage" tables for all measured points and in the graphical form. Every data presentation window has two kinds of toolbars, for standard and non standard graphics. Standard graphics is always a standard 2-dimensional plot, representing digital data.
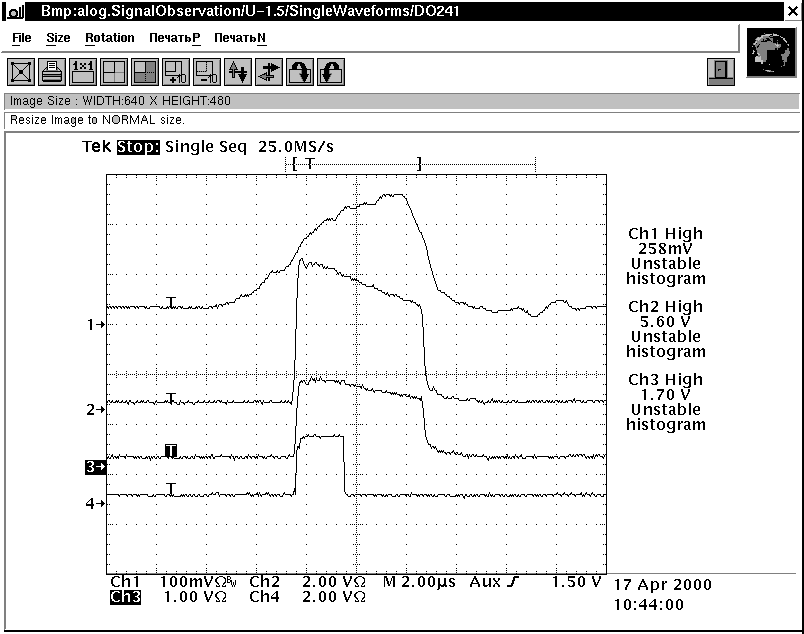
Figure 4: Tektronix Hardcopy on X-Terminal screen.
When the non standard graphics is inquired, either the screen Hardcopy of chosen oscilloscope (Fig. 4), or BMP image for LeCroy in Sequence mode (Fig. 5) is displayed.
The system updates the images on X-terminal while receiving the fresh data. Any data as well as a screen Hardcopy can be printed with on-line printer.
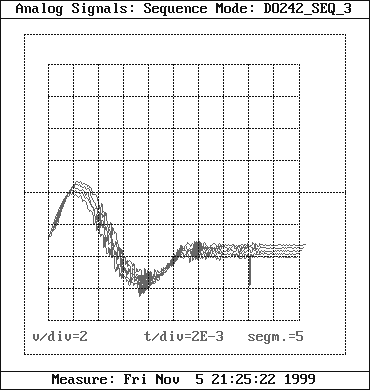
Figure 5: Three-dimensional BMP picture for the sequence of LeCroy data.
To facilitate analog signal observation on computers in office network separated from control network the system makes special copy of all digital data on the network disk with common access.
The example of analog signals reconstruction under Windows is shown in Fig. 6. The special application program is used for this purpose [6] .
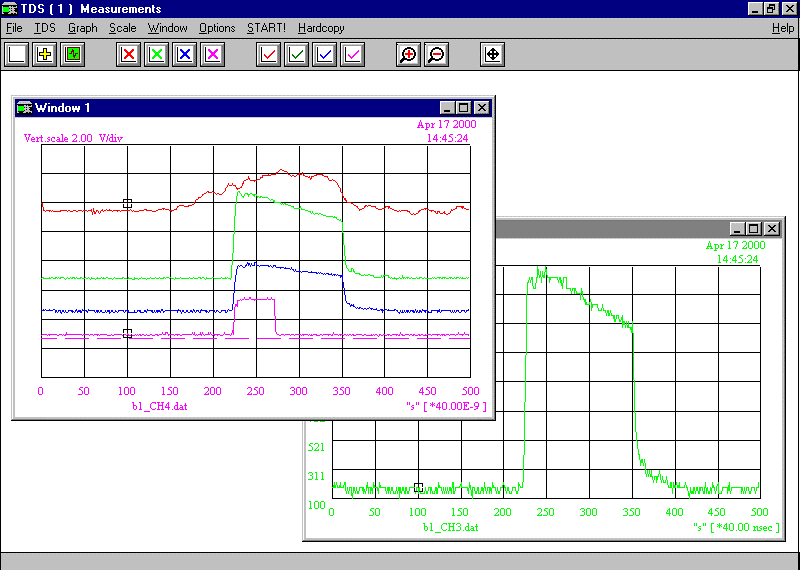
Figure 6: The view of the same signals (Fig. 4) under Windows. The curves were reconstructed using digital data acquired by ASOS.
4 ASOS PARAMETERS MANAGEMENT
For ASOS parameter management every PC has a control table in its part of the database. Such a table to control the oscilloscopes data acquisition on the Linear Accelerator is represented in Fig. 7.
The control table has 6 columns, according to the number of the maintained oscilloscopes.
Parameters of management:
- Scopes names.
- Ready - Allows to define whether to serve
particular oscilloscope or not.
- Scopes types - TEKTRONIX or LECROY.
- Channels number - 2 or 4.
- Operation - Three variants are possible:
SINGLE - 500 points of single curve are got for all channels. Then the copy of the screen is read as a graphic image. The mode is applicable to the both types of devices.
SEQUENCE - the mode is used only for LECROY oscilloscopes. The sequence of curves each of 500 points is read during passage of the requested number of external trigger impulses.
Signals of accelerator timing system are used as triggers for oscilloscopes. The measuring is repeated for all input channels. Then the copy of the screen is read as a graphic image. The amount of curves in the set is equal to the number of external trigger impulses, i.e. to the number of segments (see parameter “Measure segments”). The non-standard BMP picture is created for each set.
HARDCOPY ONLY - the graphic copy of the screen is read only. No signal measuring is made. The mode is used for the both types of oscilloscopes.
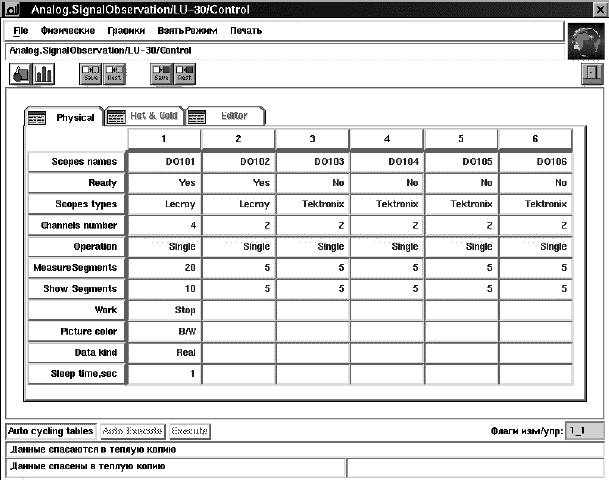
Figure 7: The ASOS control table for the Linear Accelerator.
Table parameters (fig.7) are follows:
- Measure segments - from 2 up to 32;
- Show segments - Segment amount to be represented as a BMP-picture;
- Work - run or stop;
- Picture color - b/w or color;
- Data kind - real measurements or imitation;
- Sleep time, sec. - Delay time in seconds. The delay begins after all operations with one oscilloscope are finished. It allows to postpone the manipulation with the following device for the time of this delay.
5 Summary
The submitted job is our first experience in using a PC with Linux as an equipment controller, which does not require any additional hardware for integration into the Control System, apart from a common Ethernet network and GPIB card.
ASOS operation during two accelerator runs has proved the efficiency of the applied configuration.
Independence of Control System components mentioned above (interface, data storage and representation, data acquisition) has important advantages:
- Hardware and software for data acquisition can be changed if necessary. Existing tables and graphical environment remain the same.
- On the contrary, the measuring part can be used in any other environment. The simplicity of its realization allows to include a remote analog signal observation into any control system as a permanent option.
REFERENCES
[1] V.Voevodin. “Software Architecture of the U-70 Accelerator Complex New Control System.”, Proceedings of the ICALEPCS’99, Trieste, Italy, 1999, p.457.
[2] V.Komarov, Yu.Milichenko, V.Voevodin, F.Perriolat, “New Integrated Control System of IHEP Accelerator Complex.”, Proceeding of the ICALEPCS’99, Trieste, Italy, 1999, p.639.
[3] ftp://ftp.llp.fu-berlin.de/pub/linux/LINUX-LAB/IEEE488
[4] TDS 420-460 Digitizing Oscilloscope, Programmer Manual, 1993
[5] LeCroy Digital Oscilloscopes, Remote Control Manual, 1997
[6] N.Mamuchashvili, E.Ledneva, D.Silaev, “Oscilloscope Tektronix software for the IHEP accelerator diagnostic tasks.”, Proceedings of the XV National Conference on Accelerators,Protvino, 1996, vol. 1, p.226. ( In Russian).
